CRE “By the Numbers”: Using Multiple Metrics
Up till now in the “By the Numbers” series, we’ve examined several different CRE return metrics and have delved into what each of them tells investors.
An idea touched on throughout the series is that no single metric provides a “complete” view of any investment. We’ve also noted that the usefulness of specific metrics is largely dependent on what an investor wants from a deal.
Are they looking for stable, dependable income? Or are they comfortable with high risk for a high payoff?
With that in mind, in this edition we focus on how different metrics can be used to give investors the information they need and how to combine them to better understand the deal on the table.
Risk and Reward
First, let’s revisit two metrics we’ve covered earlier in the series: Internal Rate of Return (IRR), and Equity Multiple (EM).
The IRR value (expressed as a percentage) gives investors a general idea of the returns they can expect to receive. Higher IRR values are usually associated with higher risk projects.
For example, a new ground-up construction project might have an IRR around 20%. A safer investment, like an existing property that requires very little work, may only generate an IRR of 10%.
This makes sense in that investors who are willing to take on a riskier project should, in theory, reap higher rewards.
Time in the market
Another factor in the IRR calculation is when returns are paid out. Because IRR factors in the time value of money, amounts paid out earlier tend to skew the IRR percentage higher. In other words, money you get back sooner is considered worth more than money you get back later.
And this is where things can get tricky.
Is that high IRR value really telling you that one deal is better than another? Or does it just pay out higher amounts in the initial stages but actually earn you less money overall?
This is where our second metric, the Equity Multiple (EM), comes in useful. EM tells you how much money an investor will receive in total, and it can therefore be used to “fact check” high IRR values for projects that have shorter holding periods. Consider the following example:
(Source: Reonomy)
In this case, Investment A has a higher IRR, because a larger amount of the return is distributed early (USD50,000 in Year 1). But if we look at the amounts paid over the entire holding period, Investment B is a better choice in terms of the overall return (EM) the investor can expect to receive.
By using both IRR and EM, it’s therefore possible to get a far more nuanced view, and to prioritize the factors that are most important for a specific investor.
Adding Cash-on-Cash-Return (CoCR)
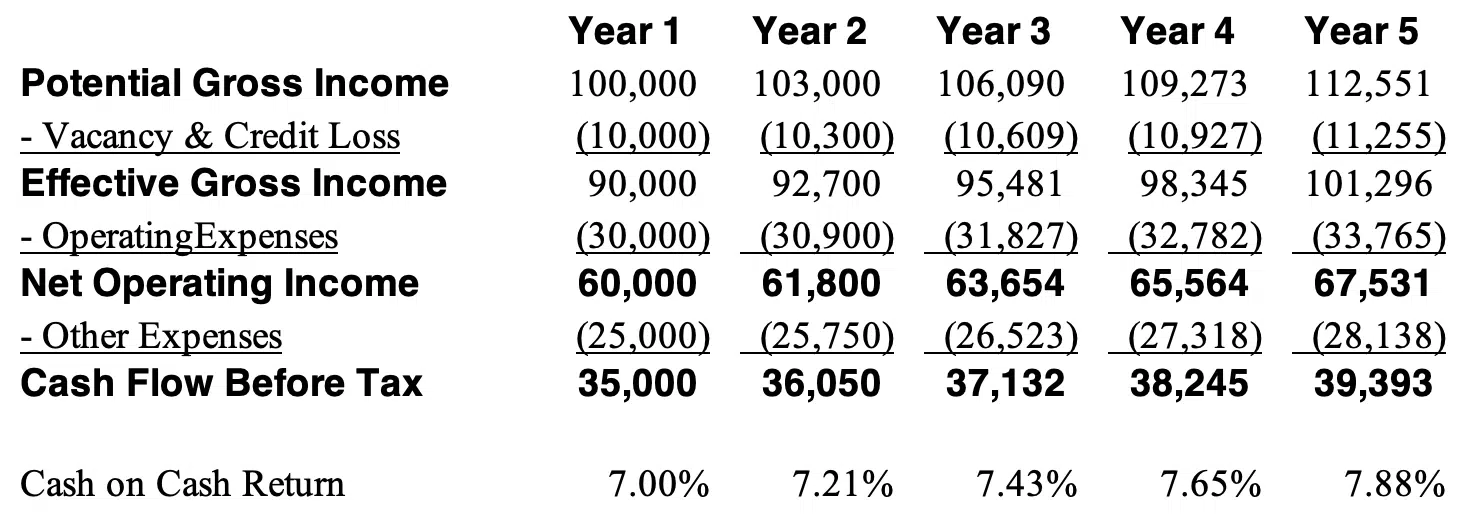
A third metric to consider when weighing up investor requirements is Cash-on-Cash-Return. For many investors, real estate is a way of generating steady income flow, and they’ll prioritize deals that have long holding periods with reliable yearly returns. Cash-on-cash gives those investors an indication of what to expect.
Generally, these types of investors are looking for stable properties that need little in the way of improvements and they might expect a CoCR of anywhere from 6-9%. The trade-off here is that the IRR will generally be lower for these properties than other project types, and the hold period will need to be longer to boost the EM.
Ground-up construction projects on the other hand will generate no (or very little) CoCR in early years but offer high IRR values and a high EM that pays out earlier.
Importantly, CoCR figures can be presented both as an average value over the hold period or on a year-by-year return basis, which may vary considerably. For example, on a “value-add” property, the CoCR may be lower in early years while renovations are done, and then higher thereafter, making it important that investors understand the full picture.
Mitigating factors
As with any discussion of return metrics, it should be noted that none of these figures “exist in a vacuum.” Savvy CRE professionals know that there are many other factors that influence returns, including the market the asset is in, the work and risk involved in realizing returns, and the prevailing economic conditions that could affect the investment.
The role of the broker is to navigate these considerations, and use the information return metrics provide, to give clients the most comprehensive and accurate view of what to expect from any deal.