CRE “By the Numbers”: Cash and Equity
So far in “By the Numbers” we’ve looked at several different metrics that can be used to understand potential returns on properties and communicate those returns to investors.
Some, like Internal Rate of Return (IRR), provide detailed information on how a property will perform over time, taking into account factors like the time value of money in the process. Others, like capitalization rate, are more of a ‘snapshot’ of a property’s current situation.
Added to the mix with this edition are two more useful metrics that provide ‘quick and simple’ estimations of a property’s payoff: Equity Multiple (EM) and Cash-on-Cash Return (CoCR).
Easy EM
A property’s Equity Multiple provides a simplified answer to the question: How much money will this investment make overall?
A more formal definition of EM is: “the total cash distributions received from an investment, divided by the total equity invested.”
The formula for calculating EM is therefore: EM = Total cash distributions/ Total equity invested
As an example, consider a scenario where the equity invested was USD100, 000, and the property generated USD7,000 per year in Net Operating Income (NOI). After five years, the property is sold for USD140,000.
In this scenario EM = (140,000 + 35,000)/100,000 = 1.75
This is an easily digested piece of information for investors that allows them to compare potential investments. Of course the above calculation is a straightforward example that doesn’t consider the impact of leverage, which can amplify returns but also potentially losses!
Cash-on-cash-return (CoCR)
Our second metric, cash-on-cash-return, answers a different question. Essentially CoCR tells us: How much regular income will this property generate?
Cash-on-cash-return looks at cash flows on a yearly basis and is therefore usually expressed as a percentage for a given year. For example, if an investor receives USD7,000 on an investment of USD100,000, the CoCR would be 7,000/100,000 or 7%.
The full formula for CoCR is:
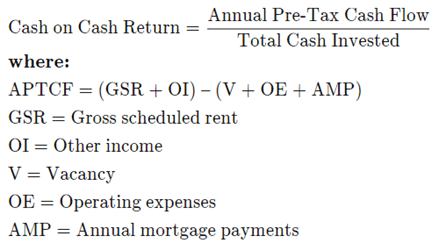
(Source: Investopedia)
As the above equation shows, the “Annual Pre-Tax Cash Flow” portion of the equation accounts for operational costs, repayments, and income the property generates. Though the overall APTCF value will vary from year to year, it’s often possible to give a general projection of what the percentage would be each year for the term of the investment.
This type of information can be invaluable for investors that are using their property investment to supplement other income sources, for example, retirees. For those individuals, a high CoCR can sound very attractive.
Worth noting, however, is that a high CoCR can also be an indication of high cap rate. And as we discussed in a previous blog, a high cap rate is often a sign of a higher risk investment.
Mixing metrics
As with other return metrics, the value of EM and CoCR depends very much on the priorities of the investors involved in a deal. What sort of timeframes are they working with? How important is immediate cash flow versus long-term value? And how much risk is too much?
Equally important to remember is that no single return metric can provide a completely nuanced picture of all those factors.
With that in mind, we’ll be delving deeper into return metrics, and their interactions, in the next edition. So check back soon for more on CRE “By the Numbers.”